A broken menu, a button that does nothing, a media uploader that won’t open. Most of the time, it’s a JavaScript error hiding in the browser console.
You don’t need to be a developer to find it. Your browser already has the tools. Once you know where to look, you can fix the problem yourself or give support the exact info they need instead of a vague “it’s broken”.
TLDR
Open your browser console (Ctrl+Shift+J on Windows, Cmd+Option+J on Mac), reload the page, and look for red error messages. The error will show the file name and line number causing the issue. If a performance plugin is deferring jQuery, that’s the most common cause. Exclude /wp-includes/js/jquery/jquery.min.js from optimization and the error usually goes away.
Check another browser first
Before anything else, open your site in a different browser. If the problem doesn’t show up there, it’s a browser-specific quirk or a caching issue. If it happens in both, it’s a script error on the site itself.
Note which browsers are affected. That detail saves time if you end up contacting support.
Turn on SCRIPT_DEBUG
WordPress loads minified versions of JavaScript files by default. These are harder to read when something goes wrong. Enabling SCRIPT_DEBUG forces WordPress to load the full, uncompressed versions instead.
Open your wp-config.php file and add this line before “That’s all, stop editing!”:
define( 'SCRIPT_DEBUG', true );Reload your site. If the issue disappears, it was a minification or caching problem. Report it to the plugin or theme developer and set SCRIPT_DEBUG back to false.
If the issue persists, keep going.
Open the browser console
Every modern browser has developer tools built in. Here’s how to get to the console:
- Chrome: Ctrl+Shift+J (Windows) or Cmd+Option+J (Mac).
- Firefox: Ctrl+Shift+K (Windows) or Cmd+Option+K (Mac).
- Safari: Safari > Preferences > Advanced > enable “Show Develop menu”, then Develop > Show JavaScript Console.
- Edge: F12, then click the Console tab.
Find the error
With the console open, reload the page. Errors show up in red. The common ones:
Uncaught TypeError: Cannot read property 'x' of undefinedUncaught ReferenceError: jQuery is not definedUncaught ReferenceError: $ is not definedClick the error to expand it. You’ll see the file name and line number where the problem lives:
jquery.js:2 Uncaught TypeError: Cannot read property 'x' of undefined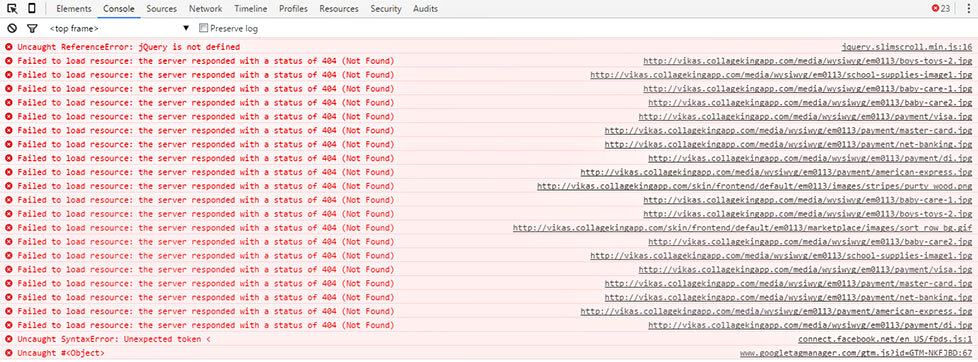
That file name and line number are the most useful piece of information for troubleshooting. Copy them.
The “jQuery is not defined” case
This error deserves its own mention because it accounts for a huge portion of WordPress JavaScript issues. It means something on your site tried to use jQuery before it loaded.
The usual causes: a performance plugin deferred or delayed jQuery, a theme deregistered it, or a script loaded in the wrong order.
There’s a full breakdown on fixing the “jQuery is not defined” error in WordPress if you’re hitting that specific one.
What to send support
If you’re contacting the plugin or theme developer (or WooCommerce support), include:
- Which browsers show the issue.
- Whether enabling
SCRIPT_DEBUGchanged anything. - The exact error message from the console.
- The file and line number.
- A link to the page where it happens.
- The full stack trace if you can expand the error for more detail.
A screenshot of the console with these details visible is worth more than a paragraph describing the problem.
Clean up after debugging
Set SCRIPT_DEBUG back to false when you’re done. Loading unminified scripts on a live site slows things down.
If the issue only shows up when you’re logged in, try disabling your browser extensions. Some of them interfere with the WordPress admin, especially ad blockers and privacy tools.
For deeper PHP-level debugging, enabling WP_DEBUG and reading the error log is the next step.